Integrative Microbiomics
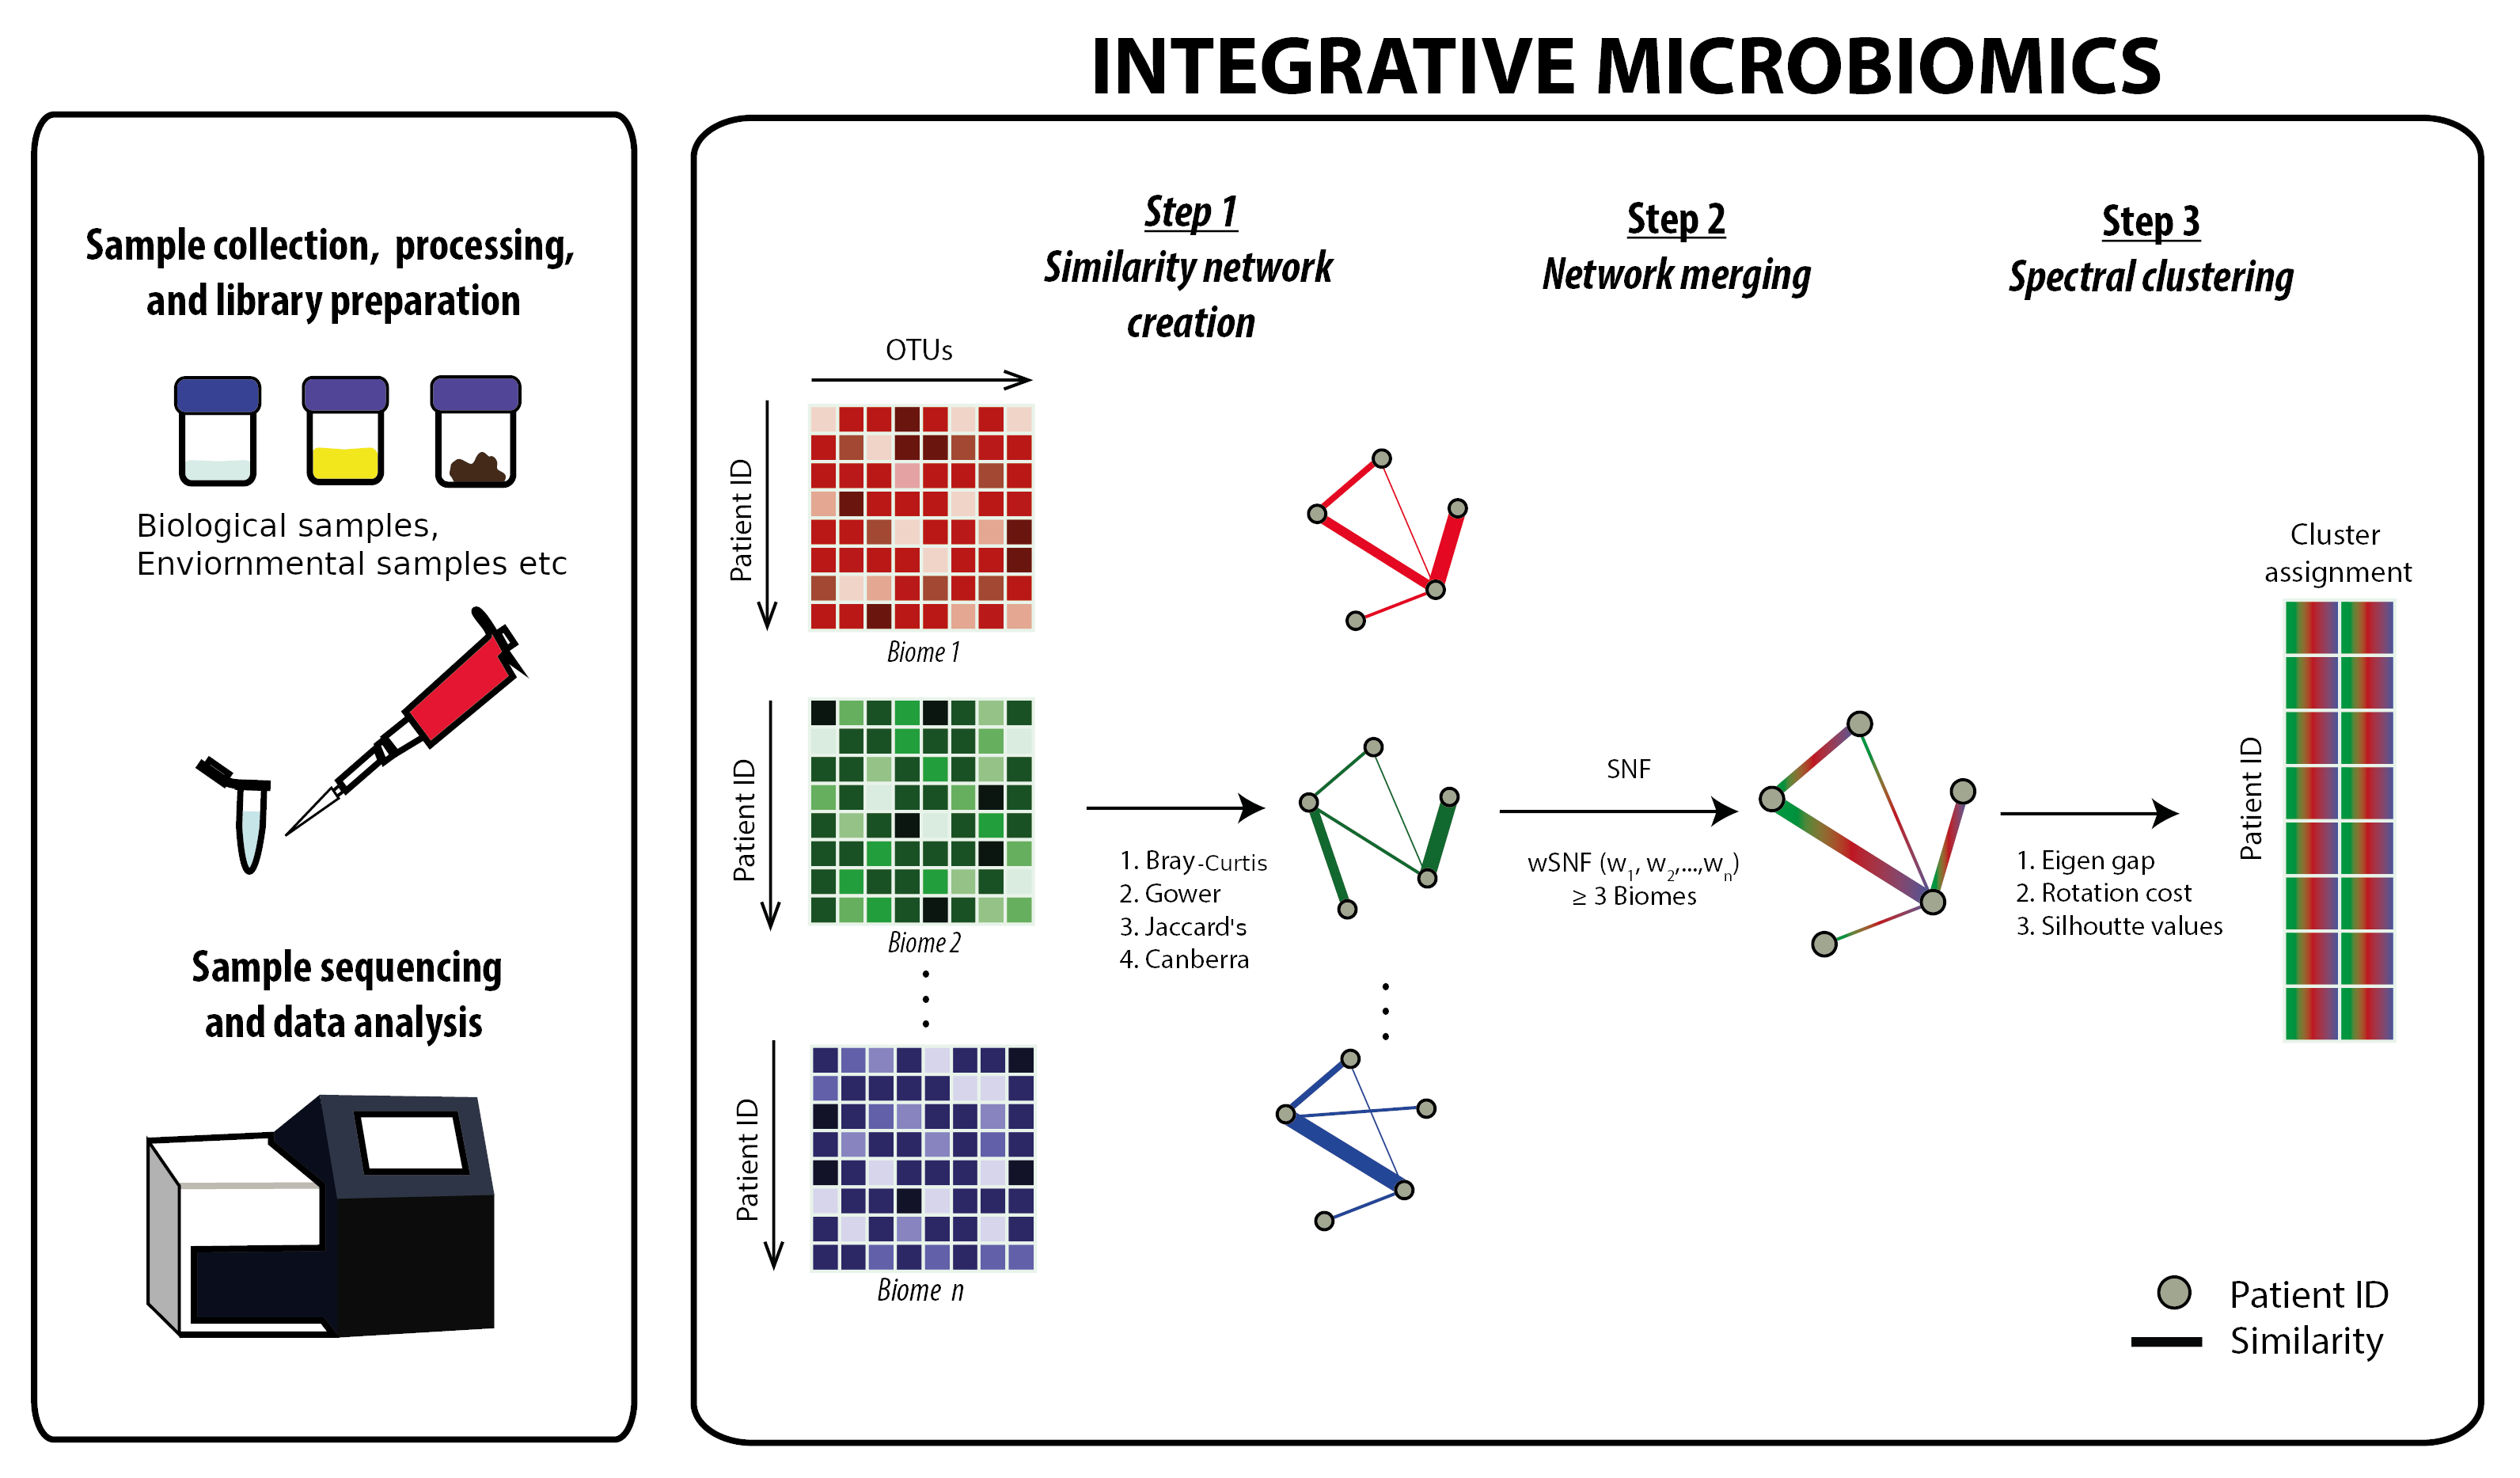
Integrative microbiomics is a tool that allows merging of microbiome datasets from the same set of samples and/or individuals to provide a more holistic view of intra-kingdom interaction. In addition, the tool implements spectral clustering following data integration that allows for a cluster analysis on the merged microbiome datasets.
How to use this tool?
- Convert your microbiome dataset into this example format before using the tool.Please ensure the individual ID's for each sample are ordered in the same manner between the various microbiomes (i.e. bacteriome, virome and mycobiome)
- The tool can be used with prior normalised read counts and relative abundance (not necessarily sum to 1, if filtering is applied)
- Click on the 'Microbiome submission' tab to upload your microbiome datasets. A plot representing the abundance of the various microbes/species from your uploaded dataset will appear. You can choose to change the number of species presented by increasing the value in the 'Number of Species' bar.
- Click on the 'Next' button, this brings you to the 'parameter selection' tab. This tab allows you to modify the default parameters used in the merging process including a selection based on the different merging algorithms and similarity measures used in subsequent analysis (see SNF and wSNF below for further information)
- Click on the 'Merge' button. This brings you to the 'Cluster Visualisation' tab. This page offers a variety of metrics and/or values to help you decide on the optimal number of clusters relevant to your dataset. Note: It is important that you do not rely on a single value and/or method to decide this as no single function can reliably provide the ‘true’ value of optimal clusters. The optimal value for number of clusters should then be set within the Optimal Number of Clusters before proceeding
- Click Similarity Plot which will provide a plot of the fused/merged similarity matrix of all individual datasets. The axes represent the reordered individuals or samples based on cluster membership. Clicking Log Similarity Plot generates a ‘log’ version of the same similarity matrix. This is sometimes useful for easier/clearer visualisation.
- Download Label files enables a download of the labels (cluster membership) for all individuals and/or samples within your dataset
- Download Fused Similarity matrix enables a download of the integrated/fused similarity matrices for further downstream analysis (if required)
- K Nearest Neighbours : The number of samples (or individuals) used to calculate local affinity. The default is set to n/10, where 'n' represents the total number of individuals. See established and published methodologies related to SNF for further clarification
- Number of iterations : The number of iterations used to establish the similarity matrix. See established and published methodologies related to SNF for further clarification
- K Nearest Neighbours & Number of iterations : As described above
- Respective assigned ‘weight of each microbiome’ : This command assigns a ‘weight’ to each respective microbiome included in the merging process. The default is set to the ‘number of the microbes/species’ present in any particular microbiome (i.e. bacteriome, virome and/or mycobiome)
Similarity Network Fusion
Weighted Similarity Network Fusion
Click on Next to proceed
Choose a Similarity Metric
A similarity metric is a measure or function that defines distances and/or similarities between samples. For example, Bray-Curtis Similarity is a common metric applied in ecology or to human microbiomes.
Choose an an algorithm for data merging
An algorithm for data merging is a method or process through which the respective datasets are integrated.
Tuneable Parameters
The default value is automatically computed based on your uploaded dataset
Average Silhouette Width
The below table represents the average silhouette width for different numbers of clusters. The silhouette value represents a measure of how similar an object or individual is to its own cluster (cohesion) when compared to other clusters (separation). Silhouette width ranges from −1 to +1, where higher values indicate that the object or individual is well matched with its own cluster and poorly matched to neighbouring clusters. We recommend not solely depending on average silhouette width (as illustrated below) when selecting your optimal cluster number. Instead, one should consider average silhouette width along with best eigen gap and rotation cost (see optimal number of clusters section) in choosing the optimal cluster number for your dataset.
Optimal Number of Clusters
As a default, an ensemble-based voting of three differing methodologies (1) Best Eigen Gap (2) Rotation cost and (3) Average silhouette width has been used by the tool (as indicated above) to determine the optimal (best) number of clusters for your dataset (see: Supplementary methods from Mac Aogáin, Narayana et al).
Integrative Microbiomics
This webtool has been developed to allow an integration of microbiome data. When you have used this tool to analyze your data, please cite this methodology as: link.